
 Q. No.
Given below is the structure of a lipid. The excess of this compound in human blood can lead to:

1. Alzheimer’s disease
2. Phenylketonuria
3. Atherosclerosis
4. Rheumatoid arthritis
2. Phenylketonuria
3. Atherosclerosis
4. Rheumatoid arthritis


Shown below is a level of structural organization of a protein. Which of the following proteins attains its final form as this structure

1. Keratin
2. Fibroin
3. Tropo-collagen
4. Myoglobin
The following diagram depicts the structure of a:

1. Nucleoside
2. Nucleotide
3. Nitrogen containing Monosaccharide
4. Glycoprotein


The chitinous exoskeleton of arthropods is formed by the polymerisation of–
1. D- glucosamine
2. N- acetyl glucosamine
3. Lipoglycans
4. Keratin sulphate and chondroitin sulphate

To unlock all the explanations of 37 chapters you need to be enrolled in MasterClass Course.
To unlock all the explanations of 37 chapters you need to be enrolled in MasterClass Course.
Look at the graph given below. The reaction rate, of the reaction, can be increased beyond point C by:

| 1. | increasing the amount of substrate |
| 2. | adding more water |
| 3. | increasing the temperature |
| 4. | decreasing enzyme concentration |
To unlock all the explanations of 37 chapters you need to be enrolled in MasterClass Course.
To unlock all the explanations of 37 chapters you need to be enrolled in MasterClass Course.
What level of protein organization structure explains the 3-D shape of an enzyme?
| 1. primary structure | 2. tertiary structure |
| 3. secondary structure | 4. quaternary structure |
To unlock all the explanations of 37 chapters you need to be enrolled in MasterClass Course.
To unlock all the explanations of 37 chapters you need to be enrolled in MasterClass Course.


Given below is a schematic metabolic pathway. In an experiment, the concentration of enzyme 1 was increased but the concentration of enzymes 2 and 3 were kept constant. What would happen to the rate of production of D?
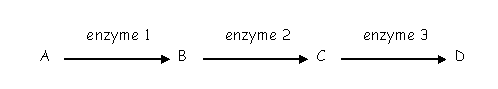
1. it would go down
2. it would go up
3. it would stay the same
4. it would stop
The graph shown below shows the effect of a certain factor on the rate of a reaction catalyzed by an enzyme. The X-axis would show the said factor and that will be:

| 1. substrate concentration | 2. pH |
| 3. enzyme concentration | 4. temperature |
To unlock all the explanations of 37 chapters you need to be enrolled in MasterClass Course.
To unlock all the explanations of 37 chapters you need to be enrolled in MasterClass Course.
In the following graph, the X-axis will show:

| 1. | substrate concentration |
| 2. | enzyme concentration |
| 3. | pH |
| 4. | enzyme concentration or substrate concentration |


The rate of enzyme action decreases at higher temperature [after a certain value] because the increased heat
| 1. | changes the pH of the system |
| 2. | alters the active site of the enzyme |
| 3. | neutralizes the acids and bases in the system |
| 4. | increases the concentration of the enzyme |
To unlock all the explanations of 37 chapters you need to be enrolled in MasterClass Course.
To unlock all the explanations of 37 chapters you need to be enrolled in MasterClass Course.
© 2026 GoodEd Technologies Pvt. Ltd.